The Tests
The second set of performance tests is a chance to compare my results with my baseline numbers. I wrote a bit more about those here, in case you'd like to catch up. But I'll repeat the numbers below side by side with the new results for comparison.
 | |
| Bill during V02Max test |
Well...see above for yourself! In the picture, I'd only just started, so I look rather composed. By the end, I was not in such pristine form.
The other two tests are much less demanding. The static leg strength test involves having your dominant leg strapped to a dynamometer that measures the force you exert when moving your leg. There are a series of measures, from pushing against a solid force to kicking the leg out against variable resistance. The heaviest repetitions are heavy enough that you can't move the leg fast at all. The longest test involves kicking out and pulling back as rapidly as possible twenty times against less resistance. This allows for measurement of endurance as well as peak force.
The third test is body fat percentage. This is the easiest physically. You strip down to a pair of bike shorts and sit in a big egg-shaped machine. What this test lacks in physical demands, it more than makes up for in emotional ones. Humbling. To say the least.
Results: Getting Better!
I went into the testing period thinking I might have improved some, but with modest expectations. So it was really heartening to see that I improved quite a bit on all of the measures! Results compared with baseline numbers are in the tables below, followed by some discussion.
| Leg Strength | Baseline | Midpoint |
| % of bodyweight | 85 | 147 |
| Body Composition | Baseline | Midpoint |
| weight (kg) | 75.6 | 76.4 |
| % of lean body mass | 23.1 | 22.3 |
| V02Max | Baseline | Midpoint |
| ml/kg/min V02 | 43.5 | 48.3 |
| METS | 12.4 | 13.8 |
| Peak Watts | 275 | 325 |
| MAX Heart Rate (BPM) | 187 | 188 |
Discussion
First things first, that weight includes my clothes and shoes! As you can see, I gained about a pound between September and January. Not bad, given my usual spiral into winter. But this is one time I can say, without it being pure fabrication, that the weight gained was muscle rather than fat! Why? Because my lean body mass percentage improved over the same period. So far so good.
It makes sense that I gained some muscle when you look at the results of my leg strength test. In September, I was able to move 85 percent of my bodyweight with my right quadriceps (the machine isolates these). In January, I improved to 147% of my bodyweight. Big gain!
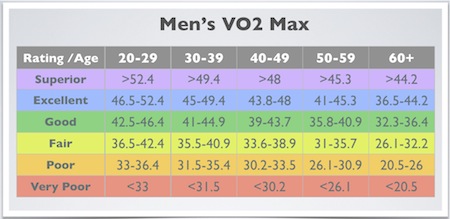
My V02Max numbers also improved more than I expected. I knew that I could push more Watts than before, based on what I was able to do on a day-by-day basis in the lab during my 30 minute continuous workouts. But it was nice to see this translated into a nearly 5% increase in V02, from 43.5 to 48.3. Here's what that translates to using the chart I linked to in an earlier post:
What Does It All Mean?
It's pretty clear to me that the kind of short (30 minutes or less per day), but intense and very, very consistent workouts I've been doing can translate to good results. And not just in my baseline fitness and potential, as the mid-point numbers show. I am seeing real improvement in my performances as well. Based on what I've done in my 30 minute workouts, for instance, here is a comparison with week 6 and last week:
| 3 x 30 Min Continuous | Week 6 | Week 14 |
| Avg. Watts | 235.38 | 240.2 |
| Avg HR (BPM) | 171 | 162 |
What that translates to is three 30 min. workouts last week, all of which topped 240W and all done at a HR that felt less like imminent death. Based on my most recent performance data, I think my functional threshold power is now somewhere between 228-232W, with peak 1 minute Watts of 325 at the end of a 30 minute effort. 30s peak power is about 375-400W. And, based on my daily experiments in pacing, I think I could do a few attacks at 300+ W in a race situation, if I rode smart and had recovery options. There will be no long breakaways above 240W, but I now see I have some tools in the toolkit to play with.

No comments:
Post a Comment