I've enrolled in a MOOC. They are all the rage these days. I'm learning about Social Network Analysis courtesy of Coursera. My friend and colleague Steve took World Music from the same outfit, and I enjoyed reading his blogs and commentary about the experience. I'm inspired to blog a bit myself about my SNA. And while this is my space to talk about marathons and bike rides and stuff, well I'm kind of taking on this MOOC in the same general spirit.
Steve had a less than thrilling experience in his course, or at least that's how I read his account of it. I'm hoping that my experience is a bit better overall. I am optimistic about this for two reasons:
- 1. I think the topic of my course - social network analysis - lends itself a bit better to an online course at a large (huge!) scale because some of the work can be evaluated by machine. Graphs are mathematical constructs, after all, and so even when we do projects working with data sets, there can be automated responses to things.
- SNA is a topic I've read about, and I've even experimented with a bit, but which I don't have adequate command over to actually use in my own work as a researcher. But I think it can be very useful to me. I read most of the textbook already. So I'm motivated to learn enough to make SNA techniques useful. This is not to say that Steve wasn't motivated, but writing essays about Cuban Jazz Fusion still likely falls into the category of things he did less for professional than for personal/curiosity reasons.

We were also asked to download a piece of software for doing Social Network Analysis called Gephi. I previously experimented with a much simpler program called GraphViz that uses a markup language (.dot) to create graphs. I was happy to see Gephi handles those too.

How the assignment worked
We were to use a simple .txt file to record answers to questions about our network's features. These questions corresponded to the concepts in lecture 1C. Then, we had to upload the answers and our graph file to an automated script that ran the same analyses we were supposed to do, compared the numbers we listed as answers to the questions, and then assigned a score.

I was a bit nervous waiting for the response to come back. I was about 66% confident I'd done it correctly. I guess I did.
Pedagogical Tips
I didn't have a lot of trouble getting this first bit of work done, but I did struggle just a bit to connect the conceptual material with the procedural steps for doing both the quizzes embedded in the lecture and the assignment. What I mean is that each time, there were key procedural steps that I was focusing on getting right that seemed only loosely connected to the more interesting concepts we were asked to consider in the lecture.
My advice to my instructor would be to clarify as much of the procedural stuff as possible - something that might require going back through the discussion forums and revising lecture slides and/or assignment sheets.
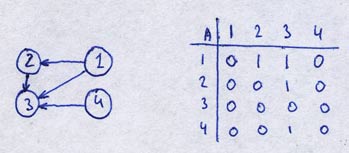
Here's one example: performing simple computations on a graph using adjacency matrices. One key fact was left out of the example and the explanation, it seems to me: the X axis refers to the source node and the Y axis refers to target nodes. Knowing this helps to clarify which dimension refers to inbound or outbound links.
Anyway...so far so good. The instructors could sweat the details a bit more, but we will see how things progress. I'm having fun so far!